Temporally inter-comparable maps of terrestrial wilderness and the Last of the Wild
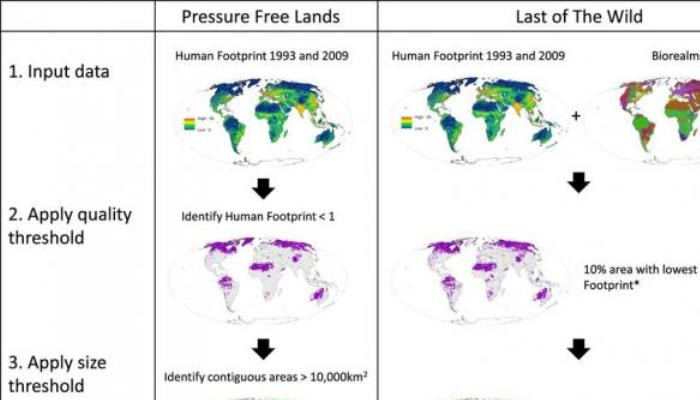
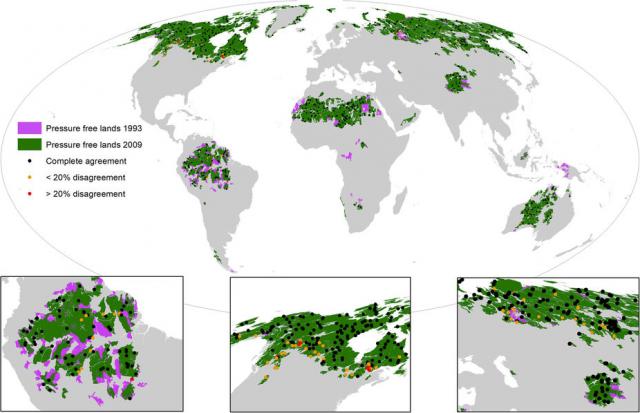
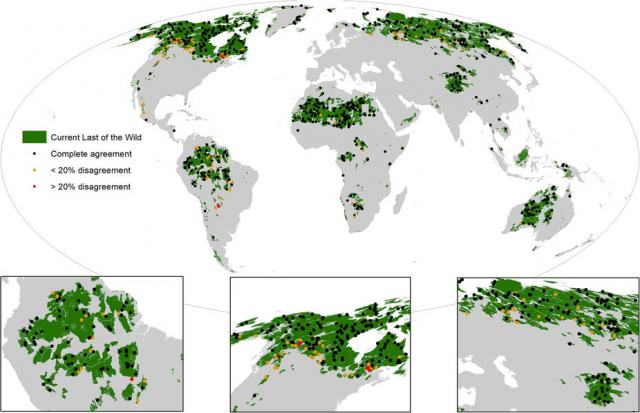
 Wilderness areas, defined as areas free of industrial scale activities and other human pressures which result in significant biophysical disturbance, are important for biodiversity conservation and sustaining the key ecological processes underpinning planetary life-support systems. Despite their importance, wilderness areas are being rapidly eroded in extent and fragmented. Here we present the most up-to-date temporally inter-comparable maps of global terrestrial wilderness areas, which are essential for monitoring changes in their extent, and for proactively planning conservation interventions to ensure their preservation. Using maps of human pressure on the natural environment for 1993 and 2009, we identified wilderness as all ‘pressure free’ lands with a contiguous area >10,000 km2. These places are likely operating in a natural state and represent the most intact habitats globally. We then created a regionally representative map of wilderness following the well-established ‘Last of the Wild’ methodology; which identifies the 10% area with the lowest human pressure within each of Earth’s 60 biogeographic realms, and identifies the ten largest contiguous areas, along with all contiguous areas >10,000 km2.Wilderness areas are ecologically intact landscapes free of human pressures which cause significant biophysical disturbance of the natural environment1,2. This includes industrial activities such as land-clearing, dense human settlements, agriculture, industry, and infrastructure development3,4. Importantly, this definition does not exclude indigenous peoples and communities, who have been part of wilderness areas for millennia through deep bio-cultural connections to the land5,6. Natural ecological and evolutionary processes continue largely unimpeded in wilderness areas, providing a suite of high-value ecosystem services7,8. These include regulation of hydrological cycles at multiple scales8,9,10, and significant organic carbon stocks11,12. Wilderness areas are also critically important for in situ biodiversity conservation, supporting the last intact mega-faunal assemblages3,13, wide ranging and migratory species14,15, and species sensitive to exploitation by or conflicts with humans16. Wilderness areas are also the last remaining places on Earth where scientists can study biodiversity and natural processes free from the influence of modern society. Maps of terrestrial wilderness areas have previously been developed by mapping the extent of a number of human pressures on the environment at both global and regional scales3,17,18, using the logic that the areas free of human pressure constitute ‘wilderness’. These maps have proved useful for numerous ecological and conservation analyses18,19,20,21. However, these maps provide a temporally static and now much outdated view of wilderness extent7,22,23, and there have been recent calls for a more updated product19. Here we present two new data-sets of spatially and temporally intercomparable maps of global terrestrial wilderness areas for the years 1993 and 2009. We used the methodological framework outlined in the original ‘Last of the Wild’ work17 but utilized the recently updated ‘Human Footprint’ maps24. These are the most up-to-date and highest resolution globally standardized maps of cumulative human pressure on the terrestrial environment25. The Human Footprint is the only pressure map to have had its data validated24, and is widely regarded as the best available product of its kind26. Our maps of wilderness areas have already been used to highlight catastrophic declines in wilderness extent over the last two decades, and show that conservation efforts has been greatly outpaced by these losses4. This has raised the profile of wilderness conservation globally12,27, and it seems that international targets for wilderness conservation may be developed shortly12,19. We anticipate that our maps will be important tools in the process of developing such targets, and for the conservation planning and decision making necessary to ensure representative protection of wilderness areas globallyThe human footprint Temporally inter-comparable maps of the ‘Last of the Wild’ for 1993 and 2009 We calculated biorealm specific thresholds on the 1993 Human Footprint scale which ensured that at least 10% of each biorealm’s land area with the lowest Human Footprint in 1993 was captured. We then selected the ten largest contiguous blocks in each biorealm and all contiguous areas >10,000 km2 to create the Last of the Wild dataset for 1993. The same biorealm specific thresholds identified for the 1993 map for the 10% area with the lowest Human Footprint score for 1993 were also used to map the 2009 Last of the Wild so that it is possible to directly compare changes in wilderness extent across the two time periods. Finally, we created a map of the Last of the Wild for 2009 where we calculated the biorealm specific thresholds on the 2009 Human Footprint scale which ensured that at least 10% of a biorealms land area with the lowest Human Footprint in 2009 was captured (for the previous maps we used the 1993 threshold to ensure maps from the two time periods are comparable). This map is not comparable with the 1993 map, but is important since it shows the current best quality habitat left in all the biorealms.   |

Ai, Japanese chimpanzee who counted and painted, dies at 49
79118.01.2026, 15:12
Flat-headed cat not seen in Thailand for almost 30 years is rediscovered
95601.01.2026, 21:32
«Living in Yerevan becomes more dangerous for life with each passing year»: Kristina Karen Vardanyan (photo)
125930.11.2025, 23:53
Gramma the Galápagos tortoise, oldest resident of San Diego Zoo, dies at about 141
126730.11.2025, 10:30
Africa is splitting in two: Magnetic data shows the continent could be separated by a new ocean
116523.11.2025, 21:25
"I hope this is a good sign" - Dmitriev encounters bear in Alaska (video)
295615.08.2025, 21:56
